
Trading Volatility in Forex: Best Indicators, Strategies, and Risk Management

Trading volatility in forex means adjusting your positions for the magnitude of price fluctuations across currency pairs and sessions. For example, EUR/USD’s typical daily trading range is around 0.5%, while others like USD/ZAR or GBP/JPY regularly exceed 1%. Thus, using the same position or stop-loss sizes for all leads to unnecessary market exposure.
The excessive swings, wide spreads, and large slippage can surprise unprepared beginners who have not mastered the techniques for quantifying and analysing volatility. In this guide, we will break down the structural forces that make currencies volatile and which indicators professional traders use to track the variances of price movements.
We also rank the most volatile forex pairs and trading times with our FR RangeMatrix indicator. We then lay out high-probability volatility expansion and contraction strategies with dynamic risk management models to protect your capital during fast-moving market conditions.
Before we dive into all of it, let’s define forex volatility.
What Is Forex Volatility?
Forex volatility is a statistical measure of price movement size and velocity over time. Exchange rates constantly oscillate in a normal price discovery process to find an equilibrium, and these day-to-day movements represent the baseline level of market volatility.
However, markets can often deviate from this baseline norm. This creates two distinct volatility environments across asset classes and financial instruments:
- High volatility occurs when rapid market repricing overwhelms available liquidity, leading to sharp and violent price swings.
- Low volatility occurs when price discovery has reached equilibrium, resulting in calm and contained market moves.
Crucially, volatility shows how aggressively the market moves, not whether the trend is up or down. A forex pair can swing hundreds of pips in a single day and still finish the session where it started. Highly volatile with no trend.
Now, let’s see what makes currency markets volatile.
What Causes Forex Volatility?
Forex volatility is caused by the non-stop process of price discovery. Volatile market swings emerge when incoming buy or sell orders become heavily one-sided and there are not enough available limit orders nearby to fill them.
You can think of market volatility in terms of a simple ratio:
$$\text{Price Displacement (Volatility)} \approx \frac{\text{Order-Flow Imbalance}}{\text{Resting Liquidity Depth}}$$
The main catalysts that trigger order flow and liquidity imbalances are:
- Central Bank Policy Changes: Monetary policy drives structural currency valuations. Unexpected rate hikes or cuts, and surprise policy pivots by major central banks like the Fed or ECB trigger immediate portfolio-wide institutional adjustments.
- Economic Data Surprises: High-impact calendar releases like the NFP, CPI inflation, and GDP reports spark violent repricing whenever the reported outcome deviates sharply from the consensus forecast.
- Geopolitical Shocks and Risk Sentiment: Geopolitical escalations, trade restrictions, or political crises inject sudden macro uncertainty. These events trigger rapid institutional de-risking, driving sharp capital flows toward safe-haven assets and currencies like the USD, CHF, and JPY.
Not every volatile spike needs a macroeconomic catalyst, however. During thin-liquidity windows like the 21:00–23:00 UTC rollover and bank holidays, a thin order book offers no resistance to routine transactions. Even modest institutional flow can cause gaps in price.
Ultimately, liquidity is an amplifier for volatility, not a direct cause. Thin liquidity alone moves nothing. An empty book without an imbalance in order flow will keep the market static.
Next, we explain how traders measure and express currency market volatility.
How Is Forex Volatility Measured
Forex volatility is measured in absolute and percentage terms. The absolute range expresses market movements in pips, while the percentage range normalises that pip value against the exchange rate.
Here’s how the two measures work:
- Absolute range (pips/points): the raw distance between the high and low in pips. This is the unit stop-loss, take-profit, and position-size math work in.
- Percentage range: that same absolute trading range expressed relative to the pair's exchange rate. This ratio lets you compare volatility objectively across all asset classes and instruments.
An average move of 100 pips in EURUSD in the past 30 days is an absolute range measurement. That 100 pips move with EURUSD near 1.08 gives a relative range of 0.9%. By comparison, a 100 pip move in USDJPY at an exchange rate of 155.00 equals 0.6% for its relative range. Thus, the same pip move in USDJPY is less volatile compared to EURUSD.
Both the absolute and relative range are historical (realised) volatility measures. These are backward-looking stats that show what has already happened. Later in this guide, we will contrast historical vs implied volatility, showing how forward-looking options indices like the CVIX and VIX differ from technical indicators like the ATR, Bollinger Bands, and Keltner Channels.
First, let's examine where realised price velocity is concentrated across the FX market: which currency pairs move the most.
Most Volatile Forex Pairs
The most volatile forex pairs average 1.5 to 2 times greater moves than the highly liquid majors. Pairs like GBP/JPY, USD/ZAR, or USD/MXN can swing by 1.0% in a single trading session. Compared to the 0.5% EUR/USD average, FX crosses and exotics can effectively double or triple your risk per trade.
The table below ranks the most volatile currency pairs across the majors, crosses, and emerging market exotics.
Currency Pair Volatility Rankings
Outsized market moves stem from lower trading volumes and thinner liquidity pools. For emerging market currencies, heightened sensitivity to geopolitical and economic shocks magnifies their exchange rate fluctuations even further.
For detailed position-sizing calculations, London session playbooks, and a complete trader-profile matrix, see our complete guide on the Most Volatile Forex Pairs.
Now that we know which pairs move the most, the next question is when is the forex market most volatile. We go over that below.
Most Volatile Forex Trading Times
The most volatile forex times occur when institutional trading volume surges. Intraday volatility typically peaks during the London-New York overlap and spikes around high-impact economic reports. Macroeconomic developments like Fed and ECB policy rate changes set the broader weekly and monthly volatility cycles.
The empirical volatility dashboard below shows EUR/USD's average range by hour and day of the week. The pair's average daily range is 50.1 pips (0.43%). Its hourly range expands from an Asian-session baseline of 4.6–7.8 pips per hour to a peak of 16.4 pips at 16:00 EET time. That is roughly 2 to 3.5 times the Asian-session range.
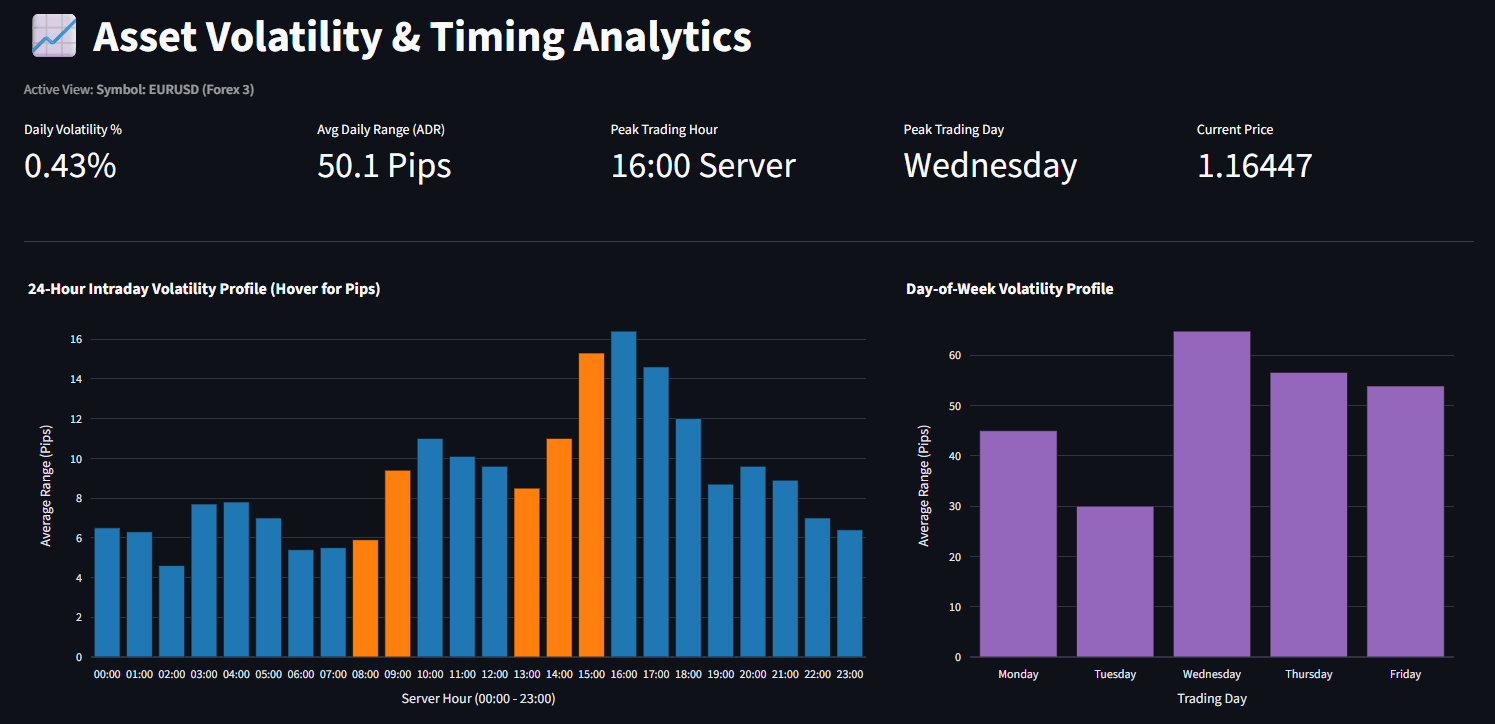
Weekly volatility follows its own macroeconomic rhythm. The EUR/USD day-of-week profile shows that trading ranges compress on Tuesday to 30.0 pips before surging 116% to peak on Wednesday at 64.8 pips. Elevated trading activity continues into Thursday and Friday, each averaging 56.6 and 53.9 pips, respectively.
To see how volatility shifts across the Tokyo, London, and New York sessions as well as which hours are the most active for your specific pairs, read our guide on the Most Volatile Forex Times and Trading Sessions.
Next, let's look at forex volatility indicators and market sentiment gauges.


