Symmetrical Triangle Pattern: The Complete Guide to Trading This Powerful Formation
Welcome to the next installment in our comprehensive series on Forex chart patterns!
After exploring the Head and Shoulders reversal pattern and the Flag and Pennant continuation formations, we now turn our attention to one of the most versatile and commonly encountered patterns in the market: the Symmetrical Triangle.
Unlike patterns with a clear directional bias, symmetrical triangles represent periods of market indecision and consolidation that can resolve in either direction—making them both challenging and rewarding to trade when approached correctly.
What Is a Symmetrical Triangle Pattern?
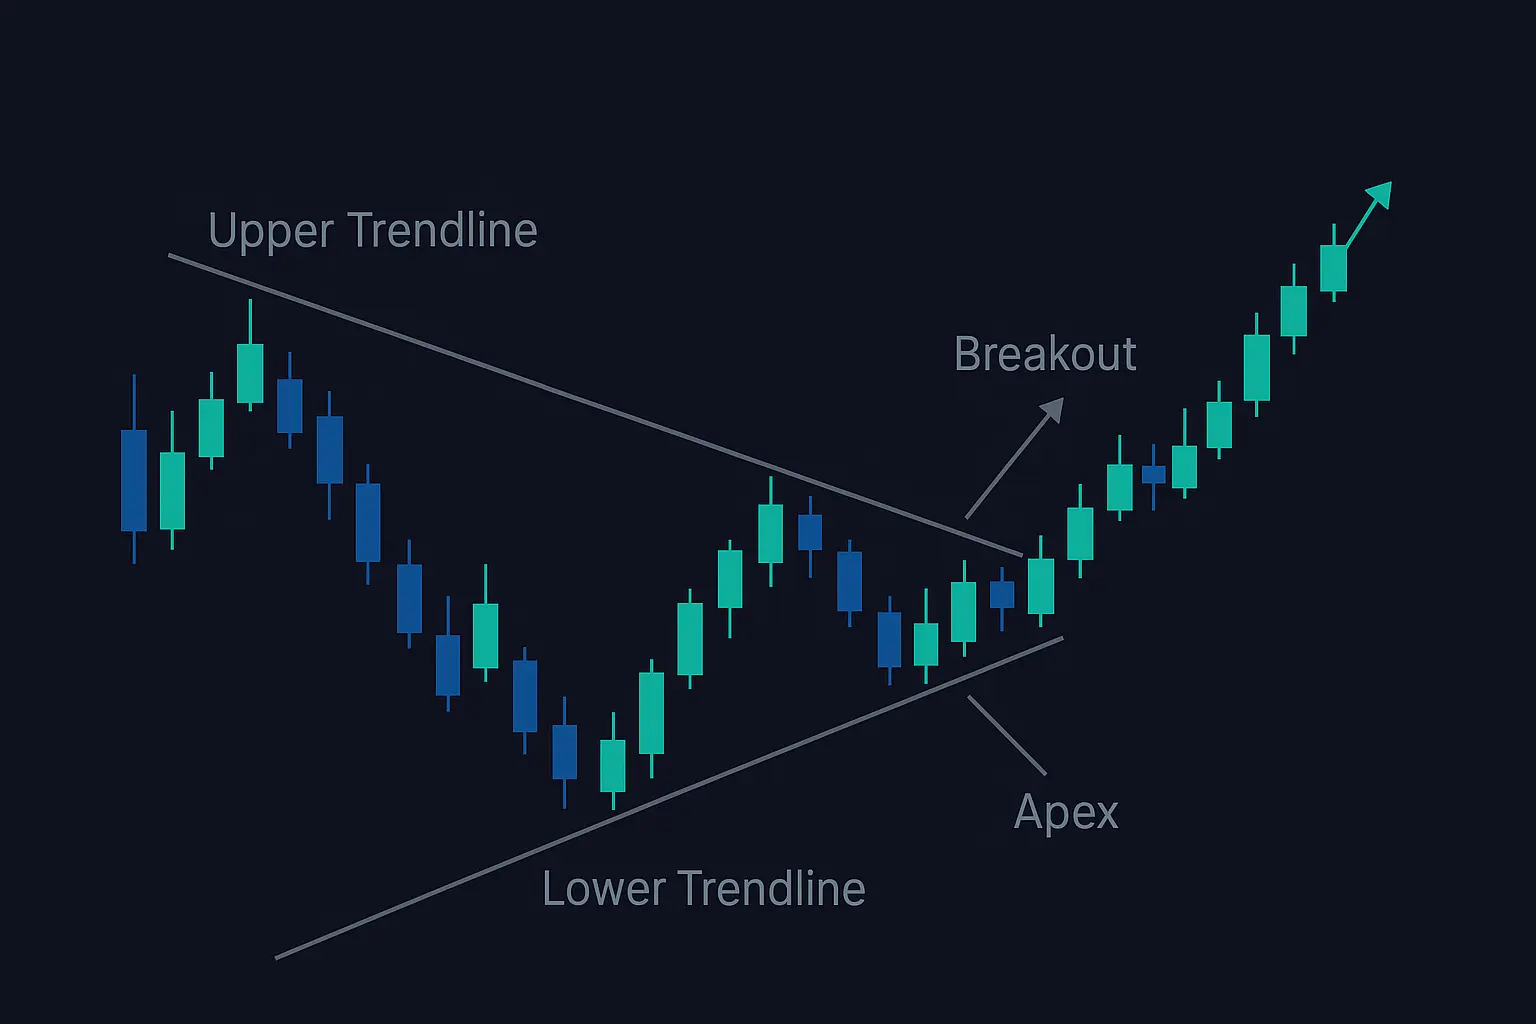
The Symmetrical Triangle (sometimes also called a coil or wedge) is a bilateral chart pattern characterized by a series of lower highs and higher lows, creating converging trendlines that form a triangle shape. This pattern represents a period of decreasing volatility and indecision in the market before a potential breakout.
The pattern consists of:
- Upper Trendline: Connecting at least two successively lower swing highs
- Lower Trendline: Connecting at least two successively higher swing lows
- Convergence Point: Where the two trendlines would eventually meet
- Decreasing Tick Volume: In Forex, many traders observe a decrease in tick volume (number of price changes per candle) as the pattern develops, but this is optional and less reliable than in centralized markets.
- Breakout Point: Where price eventually exits the pattern, signaling its resolution
Unlike ascending or descending triangles (which we'll cover in a future article), symmetrical triangles don't inherently favor either bulls or bears. Instead, they represent a temporary equilibrium between buying and selling pressure, with the eventual breakout direction often determined by the broader market trend.
Why Do Symmetrical Triangles Form?
The psychology behind symmetrical triangles is fascinating:
- Diminishing Volatility: After a significant market move, volatility naturally decreases as both buyers and sellers become more uncertain about the next direction.
- Balance of Power: Bulls become progressively less aggressive (creating lower highs), while bears simultaneously become less confident (allowing higher lows).
- Energy Accumulation: As the price compresses within the triangle, market energy builds—like a coiled spring—setting the stage for an eventual explosive move.
- Decision Point: As price approaches the apex (convergence point), the market is forced to make a decision, resulting in a breakout.
This pattern effectively captures the psychological transition from high conviction to uncertainty and back to conviction—a recurring cycle in all financial markets.
How to Identify a Valid Symmetrical Triangle
Not every consolidation with converging lines constitutes a valid symmetrical triangle. Here are the specific characteristics to look for:
Essential Components
- Prior Trend: While symmetrical triangles can form in various contexts, they're most reliable when they develop after a clear directional move.
- Minimum Touch Points: You need at least two touches on each trendline (four total points) to confirm the pattern.
- Converging Trendlines: Both trendlines must be clearly converging toward each other.
- Approximate Symmetry: The slope of the upper and lower trendlines should be roughly equal in steepness (but in opposite directions).
- Tick Volume Profile: In Forex, true volume is unavailable. Some traders look for a decline in tick volume (number of price changes per candle) as the pattern progresses, but this is only a rough proxy and should not be relied upon as a primary confirmation.
- Timeframe Consideration: The pattern should form over a meaningful period—generally at least 7-15 candles on the given timeframe.
Common Variations
- Early-Stage Formation: These triangles form relatively early in a trend and often act as continuation patterns.
- Late-Stage Formation: These develop after an extended trend and more frequently signal potential reversals.
- Apex Timeframes: Triangles can vary in how quickly they converge—those with more gradual convergence (wider apex angle) often generate more reliable breakouts.
Trading the Symmetrical Triangle: A Step-by-Step Approach
Let's break down the precise methodology for trading this pattern effectively:
1. Pattern Identification
- Identify converging trendlines with at least two touches on each boundary
- Optionally, observe for decreasing tick volume as the pattern progresses—though this is only a rough gauge in Forex and not required
- Measure the width of the triangle at its widest point (for later target calculation)
- Draw the pattern fully, extending trendlines to their convergence point (the apex)
2. Entry Strategy
Symmetrical triangles can break in either direction, so prepare for both scenarios:
For Bullish Breakouts:
- Wait for a decisive close above the upper trendline
- Confirm with a candle that closes clearly outside the pattern (not just a wick)
- Optionally, look for an uptick in tick volume on the breakout candle; in Forex, this may sometimes add confidence but is not necessary for a valid trade
- Consider these entry approaches:
- Aggressive: Enter immediately after a confirmed breakout close
- Conservative: Wait for a pullback retest of the broken trendline as new support
- Time-Based: Enter only if the breakout occurs before price reaches 2/3 of the way to the apex (breakouts near the apex have higher failure rates)
For Bearish Breakouts:
- Wait for a decisive close below the lower trendline
- Apply the same confirmation criteria as with bullish breakouts, but in the opposite direction
- Consider the same entry variations as above
3. Setting Price Targets
Symmetrical triangles provide a reliable method for projecting potential price movement:
- Measure the width of the triangle at its widest point (the "base")
- Project this distance from the breakout point in the direction of the breakout
Additional targeting approaches:
- Conservative Target: 50-75% of the projected move based on the triangle's height
- Standard Target: 100% of the measured height
- Aggressive Target: 150% of the measured height (in strong trending markets)
- Context-Based Target: Adjust targets based on nearby support/resistance levels
4. Stop-Loss Placement
Choose from these strategic stop-loss approaches:
- Pattern-Based Stop: Place your stop on the opposite side of the triangle from your entry
- Volatility-Based Stop: Place your stop beyond the most recent swing point inside the pattern, plus a buffer based on ATR (Average True Range)
- Percentage-Based Stop: Place your stop at a distance that limits risk to a predetermined percentage of your account (typically 1-2%)
For maximum protection, consider placing your stop so that a close beyond it would invalidate the pattern. Avoid placing stops exactly at the trendline, as "stop hunting" can occur at these obvious levels.
5. Trade Management Rules
Follow these guidelines to manage your symmetrical triangle trades effectively:
- Pattern Invalidation: If price breaks out and then reverses back inside the triangle, consider exiting immediately as this often signals a false breakout
- Apex Rule: Be cautious of breakouts occurring when price has traveled more than 75% of the distance to the apex—reliability decreases significantly at this point
- Partial Profits: Consider taking partial profits at 50% of your target, particularly if momentum begins to wane
- Moving Stops: As price moves in your favor, trail your stop behind significant swing points to protect profits
Real-World Forex Symmetrical Triangle Examples
Example 1: Bullish Breakout on EUR/USD (Daily Chart)
In this example:
- A symmetrical triangle formed after a moderate uptrend
- Price consolidated for approximately three weeks
- Tick volume (number of price changes) gradually decreased throughout the formation, though this is not always a necessary confirmation in Forex
- A decisive breakout occurred, and there was a moderate uptick in tick volume, which sometimes adds confidence but is not always present
- Price reached about 90% of the measured target before encountering resistance
- A brief retest of the upper trendline provided an ideal conservative entry
Example 2: Bearish Breakout on GBP/JPY (4-Hour Chart)
Key observations:
- The triangle formed during a period of market indecision
- Both trendlines had multiple clear touch points
- Tick volume dropped notably as the pattern progressed, but this is not essential for validity in Forex
- The breakout occurred at approximately 65% of the distance to the apex
- Price reached the full measured target without significant pullbacks
- No retest occurred, highlighting why aggressive entries are sometimes necessary
Advanced Symmetrical Triangle Trading Techniques
Directional Bias Assessment
While symmetrical triangles themselves don't have an inherent bias, you can gain an edge by considering:
- Prior Trend Direction: Triangles often (though not always) break in the direction of the preceding trend.
- Higher Timeframe Context: Check if the triangle is forming within a larger trend on higher timeframes. If the higher timeframe trend is strong, breakouts in that direction are often more reliable.
- Market Structure: Analyze whether the overall market structure is bullish or bearish; support and resistance zones can influence breakout potential.
- Indicator Confirmation: Use momentum indicators such as RSI or MACD to look for divergences or confirmation. For example, if RSI breaks above 50 during an upside breakout, it can add conviction to a bullish move.
Combining with Other Technical Tools
Enhance your symmetrical triangle trading by incorporating:
- Moving Averages: The 50-period MA (or 200-period for longer-term trades) can provide clues about the likely breakout direction. A triangle breakout that aligns with the slope and direction of the moving average is generally more reliable.
- Tick Volume Analysis: In Forex, true centralized volume is not available. Some traders monitor tick volume (the number of price changes per candle) as a rough proxy for activity. A noticeable increase in tick volume on a breakout candle can sometimes add confidence to the move, but it is not required and is less reliable than in stocks or futures. Always prioritize price action and pattern structure over tick volume signals.
- Fibonacci Levels: Use Fibonacci retracement or extension levels to identify potential targets beyond the measured move of the triangle.
- Multiple Timeframe Analysis: Confirm the pattern and breakout direction on multiple timeframes. If a breakout on the 4-hour chart aligns with the daily trend, the odds of success generally improve.
False Breakout Strategy
Experienced traders sometimes use a counterintuitive approach to capitalize on false breakouts, which are common in symmetrical triangles:
- Watch for a break of the triangle boundary that occurs with weak price action or without a meaningful uptick in tick volume (if you use it as a secondary confirmation).
- If price quickly fails to sustain the breakout and reverses back inside the triangle, consider entering in the opposite direction.
- Target a move to the opposite side of the triangle.
Note: This strategy is advanced and requires fast execution and strong risk management, as false breakouts can quickly turn into genuine moves.
Common Mistakes When Trading Symmetrical Triangles
Avoid these frequent errors:
- Anticipating Breakouts: Entering before a confirmed breakout often leads to being caught in continued consolidation.
- Relying Too Heavily on Volume: In Forex, relying on tick volume for confirmation can be misleading, since it's not a direct measure of actual traded volume. Focus primarily on price action and confirmation candles.
- Late Entry: Waiting too long after a breakout can result in suboptimal entry prices and risk-reward ratios.
- Tight Stops: Placing stops too close to your entry point often results in being stopped out during normal price fluctuations.
- Apex Trading: Trading breakouts that occur very near the apex (>75% to convergence) increases false breakout risk.
- Neglecting Context: Failing to consider the broader market environment and higher timeframe trends.
Why Do Symmetrical Triangles Sometimes Fail?
Understanding failure scenarios helps manage expectations:
- False Breakouts: Price breaks out but quickly reverses, trapping traders who entered in the breakout direction. This is particularly common when breakouts occur with little momentum or confirmation.
- Apex Failure: As price approaches the apex, energy may dissipate rather than build, resulting in a weak or ambiguous breakout.
- Lack of Momentum: In other markets, a breakout without corresponding volume increase often lacks the momentum to sustain the move. In Forex, watch for a lack of follow-through and be cautious if the breakout is not accompanied by strong price action—even if tick volume doesn't confirm.
- External Catalysts: Unexpected news or events can disrupt the natural resolution of the pattern.
Professional traders always prepare for both success and failure scenarios, adjusting position sizing accordingly.
Symmetrical Triangles vs. Other Triangle Patterns
To clarify the differences:
- Symmetrical Triangle: Both trendlines converge; no inherent directional bias.
- Ascending Triangle: Horizontal upper resistance, rising lower support; bullish bias.
- Descending Triangle: Horizontal lower support, declining upper resistance; bearish bias.
- Expanding Triangle: Diverging trendlines (opposite of symmetrical); signals increasing volatility.
- Pennant: Similar to symmetrical triangle but smaller, shorter-term, and forms after a sharp "flagpole" move.
We'll explore ascending and descending triangles in detail in our next article.
Conclusion: Mastering the Symmetrical Triangle Pattern
The symmetrical triangle stands as one of the most adaptable patterns in technical analysis. Its bilateral nature requires discipline and patience, but when traded correctly, it offers excellent risk-reward opportunities in both trending and transitioning markets.
Remember these key principles:
- Wait for pattern confirmation with adequate touchpoints.
- Confirm breakouts with price action and—optionally—tick volume activity (but always remember its limitations in Forex).
- Calculate your targets objectively using the pattern's height.
- Place stops at logical invalidation points.
- Consider the broader market context when determining likely breakout direction.
While no pattern offers guaranteed profits, developing proficiency with symmetrical triangles adds a versatile tool to your trading arsenal—one that works across all timeframes and currency pairs.
Note about Tick Volume in Forex:
Because the Forex market is decentralized, true traded volume data is not available. Most Forex brokers provide tick volume, which measures the number of price changes per period. While some traders use tick volume as a loose proxy for trading activity, it is not a replacement for real volume and should always be considered secondary to price action and pattern structure.
Practice Assignment: Build Your Triangle Recognition Skills
To develop your pattern recognition abilities:
- Review charts of major currency pairs over the past month and identify at least three symmetrical triangles.
- For each pattern, record:
- Which direction the breakout occurred
- Whether it reached its measured target
- What indicators or context might have helped predict the breakout direction
- What warning signs appeared in any failed patterns
- Paper trade your next two identified patterns using the rules outlined in this article.
Share your observations in the comments section below, or reach out with any questions about trading symmetrical triangles. Remember that consistent practice is the key to pattern mastery!
In our next article, we'll complete our exploration of triangle patterns by examining Ascending and Descending Triangles—two directionally biased formations that offer particularly high-probability setups when properly identified and traded.
FAQs About Symmetrical Triangle Patterns
What is the typical success rate of symmetrical triangle breakouts?
Based on trading experience and general observations, when all confirmation criteria are met (including a decisive breakout and strong price action), symmetrical triangles tend to reach at least their conservative targets in roughly 60-70% of cases. Keep in mind that actual results vary significantly based on market conditions, timeframe, and the location of the pattern within the larger trend structure.
How long does a symmetrical triangle usually take to form?
Symmetrical triangles generally take longer to form than flags or pennants. On daily charts, they might develop over 3-8 weeks, while on 4-hour charts, they might form over 1-3 weeks. The key is not the absolute time but rather the development of clear boundaries with multiple touch points.
Can symmetrical triangles predict the direction of the breakout?
Unlike ascending or descending triangles, symmetrical triangles themselves don't inherently predict breakout direction. However, contextual factors like the preceding trend, higher timeframe analysis, and technical indicators can provide clues about the probable resolution direction.
What's the optimal time to enter a symmetrical triangle breakout?
Many technical analysts observe that favorable entries often occur when price breaks out between approximately 50-75% of the way to the apex. Breakouts earlier than 50% may sometimes be premature and subject to false signals, while those beyond 75% frequently appear to lack the momentum needed for a significant move. These aren't hard rules but rather patterns observed across many instances of this formation.
How reliable is the measured move target for symmetrical triangles?
The measured move target (projecting the height of the triangle from the breakout point) serves as a useful guideline rather than an exact science. Trading experience suggests that approximately 60-65% of valid breakouts may reach their full measured targets, though this can vary widely across different market conditions. For this reason, many experienced traders take partial profits at 50-75% of the target while allowing the remainder of the position to potentially reach the full target.


