Golden Cross and Death Cross Explained: Success Rates, Examples, Strategies

A golden cross and death cross occur on the crossover of the 50-period and 200-period simple moving averages (SMA). A golden cross is a bullish signal and the death cross is bearish. Market participants, from scalpers and day traders to swing and position traders, all watch for these 50 and 200 moving average crossover patterns to help them capitalise on major trend shifts.
Our golden cross and death cross backtester indicator shows that the golden cross signal had an 87.5% win rate on the NASDAQ daily timeframe since 2010. However, the pattern had a 46% win rate on AUDUSD during the same period. This contrast highlights that traders should not automatically assume the signal works equally well in every market.
That’s why we’ll walk you through backtesting the success rates of the golden and death cross in different markets and timeframes.In this guide, we will cover:
- How to identify the patterns and examine real-world trade examples
- How trading these signals differs in forex, stocks, crypto, and other markets
- Which timeframes can be used
- Success rates and reliability
- Trading strategies you can start using today
First, let’s define exactly what the golden cross and death cross are.
What is a Golden Cross
A golden cross is the 50-day moving average crossing above the 200-day moving average. It is considered a bullish signal and confirmation of a long-term uptrend.

What is a Death Cross
A death cross is the 50-day moving average crossing below the 200-day moving average. This is a bearish signal and indicates that sellers have taken control over the broader trend.

Moving average golden cross and death cross settings
The default moving averages used for the golden cross and death cross are the 50 and the 200 simple moving averages, applied on the daily chart.
When you see the terms "death cross" and "golden cross" being mentioned without details about the moving average settings or timeframe, that almost always means that the trader is referring to a crossover between the 50 SMA and 200 SMA on the daily timeframe. These are the industry-standard parameters that the vast majority of traders, analysts, and financial media refer to.
That being said, this does not mean that you can’t build successful strategies by tweaking these settings or the timeframe.
Golden cross and death cross moving average types and combinations
While the 50 and 200 moving average combination is the classic standard for the golden cross and death cross, some traders prefer using exponential moving averages (EMA). EMAs place more weight on recent price data, which means they react faster to new price action.
That can produce earlier crossover signals, but it also increases the risk of false signals in choppy markets. Here is how the two moving average types compare when using them for the golden and death cross:
- Simple moving average (SMA) golden/death crossovers tend to be smoother and slower, which can reduce noise
- Exponential moving average (EMA) golden/death crossovers tend to be faster and more responsive, which can improve timing but increase whipsaws
Beyond the SMA vs EMA choice, some traders also adjust the moving average periods themselves. Most common alternative combinations for the golden and death cross patterns include a 50 and 100 or 100 and 200 moving averages.
Now, let's compare the golden cross versus the death cross.
Golden Cross vs Death Cross Comparison
Comparing the golden cross versus the death cross highlights how their individual success rates and reliability vary in different markets. The comparison table below summarizes the differences between them:
Both the golden cross and the death cross produce similar win rates in symmetric markets like forex. However, the golden cross outperforms the death cross in markets with an asymmetric bias. Examples are episodes of major bullish trends in stock indices and cryptocurrencies.
Let’s explore how the patterns perform across markets and how to backtest their success rates yourself.
Golden Cross and Death Cross Across Markets
The golden cross and death cross behave differently across markets because each asset class has its own structure, volatility profile, and long-term fundamental drivers.
Here are the key characteristics in different markets:
Practical applications
- Golden Cross: Best used as bullish confirmation in stock indices and during strong crypto bull runs. In forex and commodities it serves as a trend filter when macro conditions align.
- Death Cross: Often whipsaws as a bearish signal. Best used as a correction in stock and crypto markets. In forex and commodities it works well as a trend filter during established downtrends.
The key is to focus on the assets and timeframes where your own backtesting data shows a clear statistical advantage. The patterns are powerful trend-confirmation tools when used in the right context.
Success Rates, Reliability and Backtesting
The success rates of the golden cross and death cross vary depending on three main parameters:
- The specific market, asset or currency pair you trade
- The timeframe you trade
- The entry and exit rules that define a winning trade
For example, the golden cross has a 64% win rate on the EUR/USD daily timeframe over a 15 year period. However, that same signal only has a 43% success rate on AUD/USD over the same period and timeframe.
Reliability vs Win Rate
The win rate of a golden or death cross signal is only one piece of the puzzle. The pattern can have more profitable trades than losing ones and still be unreliable if the average winner is small while the average loser is large.
True reliability of a trading signal considers the full picture and overall consistency of results. To determine this, traders backtest and evaluate average return per signal, risk-reward ratio, drawdowns, sample size, and how the pattern behaves across different market regimes.
Below, we look at how to backtest the golden cross and death cross patterns.
Backtesting the Golden Cross and Death Cross
Backtesting the golden and death cross is the best way to judge their real performance on the exact market and timeframe you plan to trade. Two common backtesting methods traders use are:
- Manual Backtesting: Scroll through historical charts, mark every golden and death cross, and manually record the outcome (win or loss). This can be good practice as it builds pattern recognition skills. However, it is extremely time-consuming and inefficient.
- Use Platform Strategy Testers: Use the built-in strategy tester in platforms like MetaTrader 4/5 or TradingView. This can process years of data quickly but usually requires setting up a trading bot or expert advisor. It is a highly effective way to backtest a full automated strategy. However, for providing a quick dashboard with success rates of various methods of trading a signal, it will involve repetitive testing and retesting.
If the above two backtesting methods are not most optimal for evaluating the golden cross and death cross, then what is? Let’s look at that below.
Forex Recon Golden/Death Cross Backtester indicator
The best way to backtest the patterns and get a quick overview of their performance on various metrics is to use a dedicated indicator for that purpose. Our free Forex Recon Golden/Death Cross Backtester indicator instantly scans your chart and delivers a complete performance report without any manual work or coding.
Simply drag the indicator onto any chart and it automatically shows:
- Win rate and average percentage return after 50, 100, and 200 bars
- Performance if you hold the trade until the next opposite crossover
- Number of historical signals analyzed
- Clear overall verdict: “++ STRONG EDGE”, “~ WEAK / NEUTRAL”, or “-- NO EDGE”
This allows you to test any currency pair, stock index, cryptocurrency, or commodity in seconds and immediately see whether the golden cross or death cross has a genuine historical edge in that specific market and timeframe.
Trading Strategies for the Golden Cross and Death Cross
Trading strategies based on the golden cross and death cross work best inside a structured trading approach rather than as blind buy or sell signals. The right strategy parameters depend on the market, the timeframe, and whether backtesting shows the pattern has a genuine historical edge on the chart you trade.
Below are 3 practical strategies for the golden cross and death cross:
- Trading on lower timeframes only in direction of the crossover
- Buy and hold in markets where the success rate is high
- Using it as a contrarian indicator
1. Trade Lower Timeframes in the Direction of the Golden or Death Cross
Many traders use the golden cross and death cross as a higher-timeframe directional filter as part of their trading strategy. Instead of entering a trade the moment the crossover appears, they first use the daily chart to determine the broader bias, then drop to a lower timeframe to look for entries in that direction.
Here is how it works:
- If a golden cross appears on the daily chart, look for long setups on lower timeframes such as the 4-hour or 1-hour chart.
- If a death cross forms on the daily chart, focus only on short setups on intraday timeframes.
The actual entry can then come from price action, a breakout, a pullback to support or resistance, or from an indicator. For example, let’s look at the real case of USDJPY below, where a bullish golden cross on the daily chart produced multiple winning signals on the 4H chart.
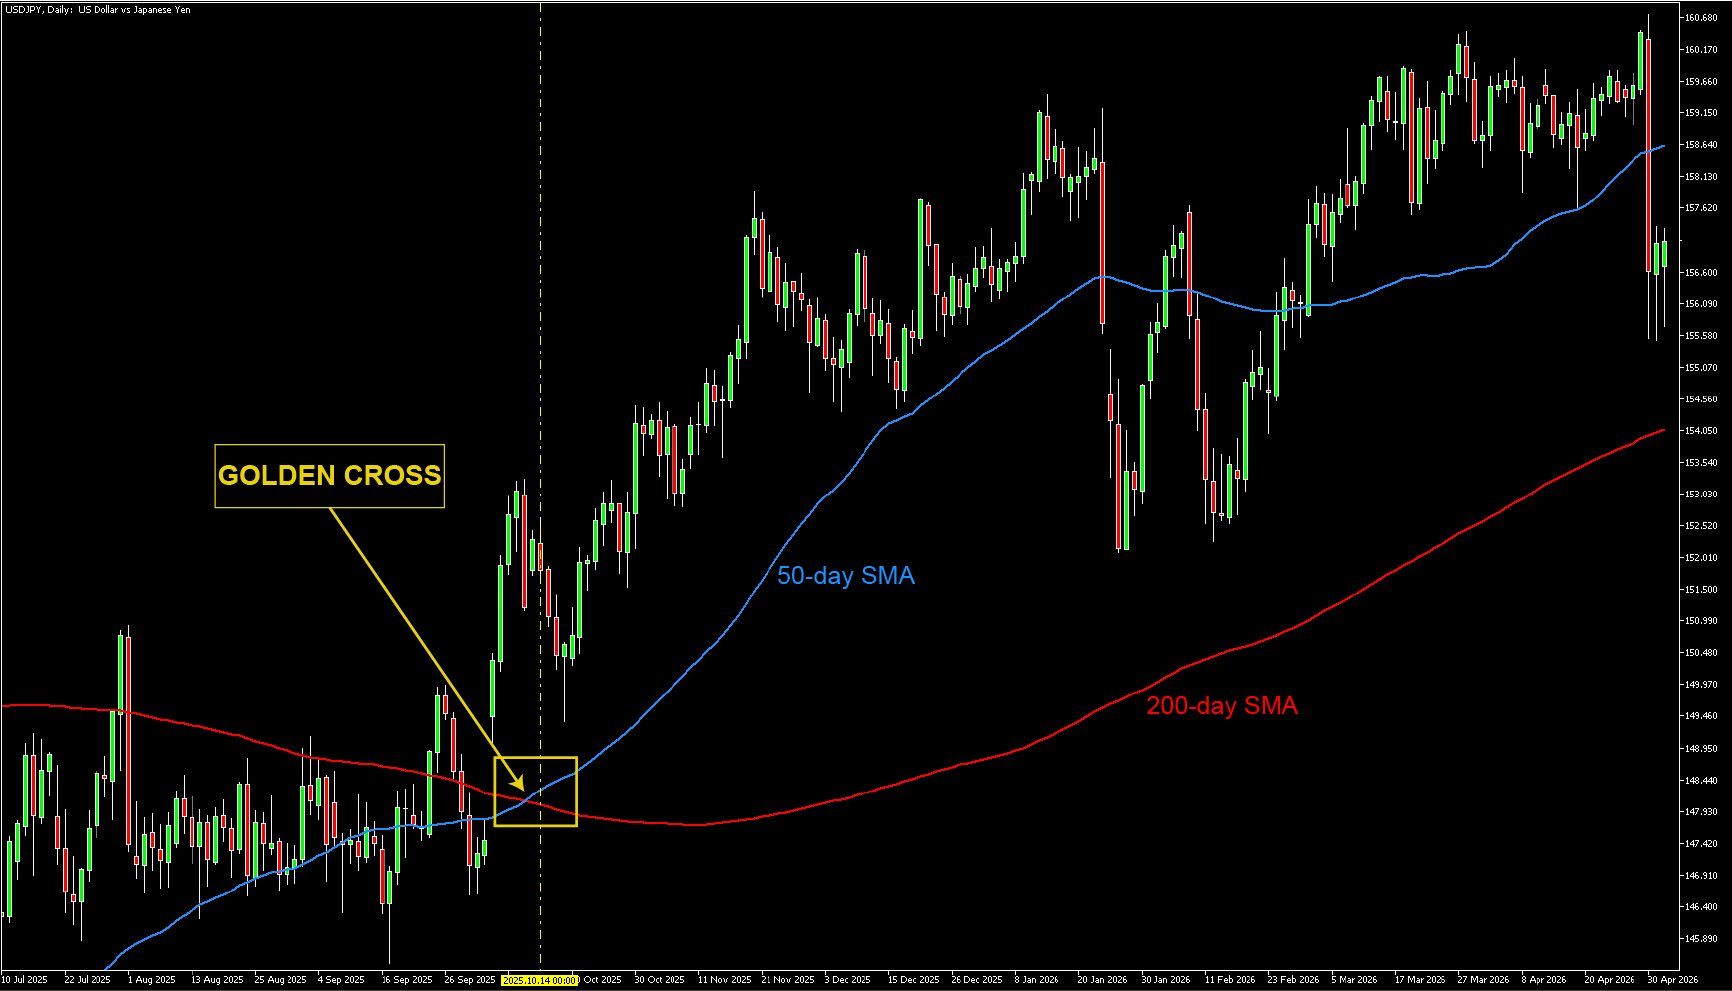
The 4H chart during the same period shows that a simple strategy using only the MACD indicator produced 5 winning signals. The strategy trades only in the bullish direction, which is the main trend as identified by the golden cross (50 SMA above 200 SMA) on the daily timeframe.
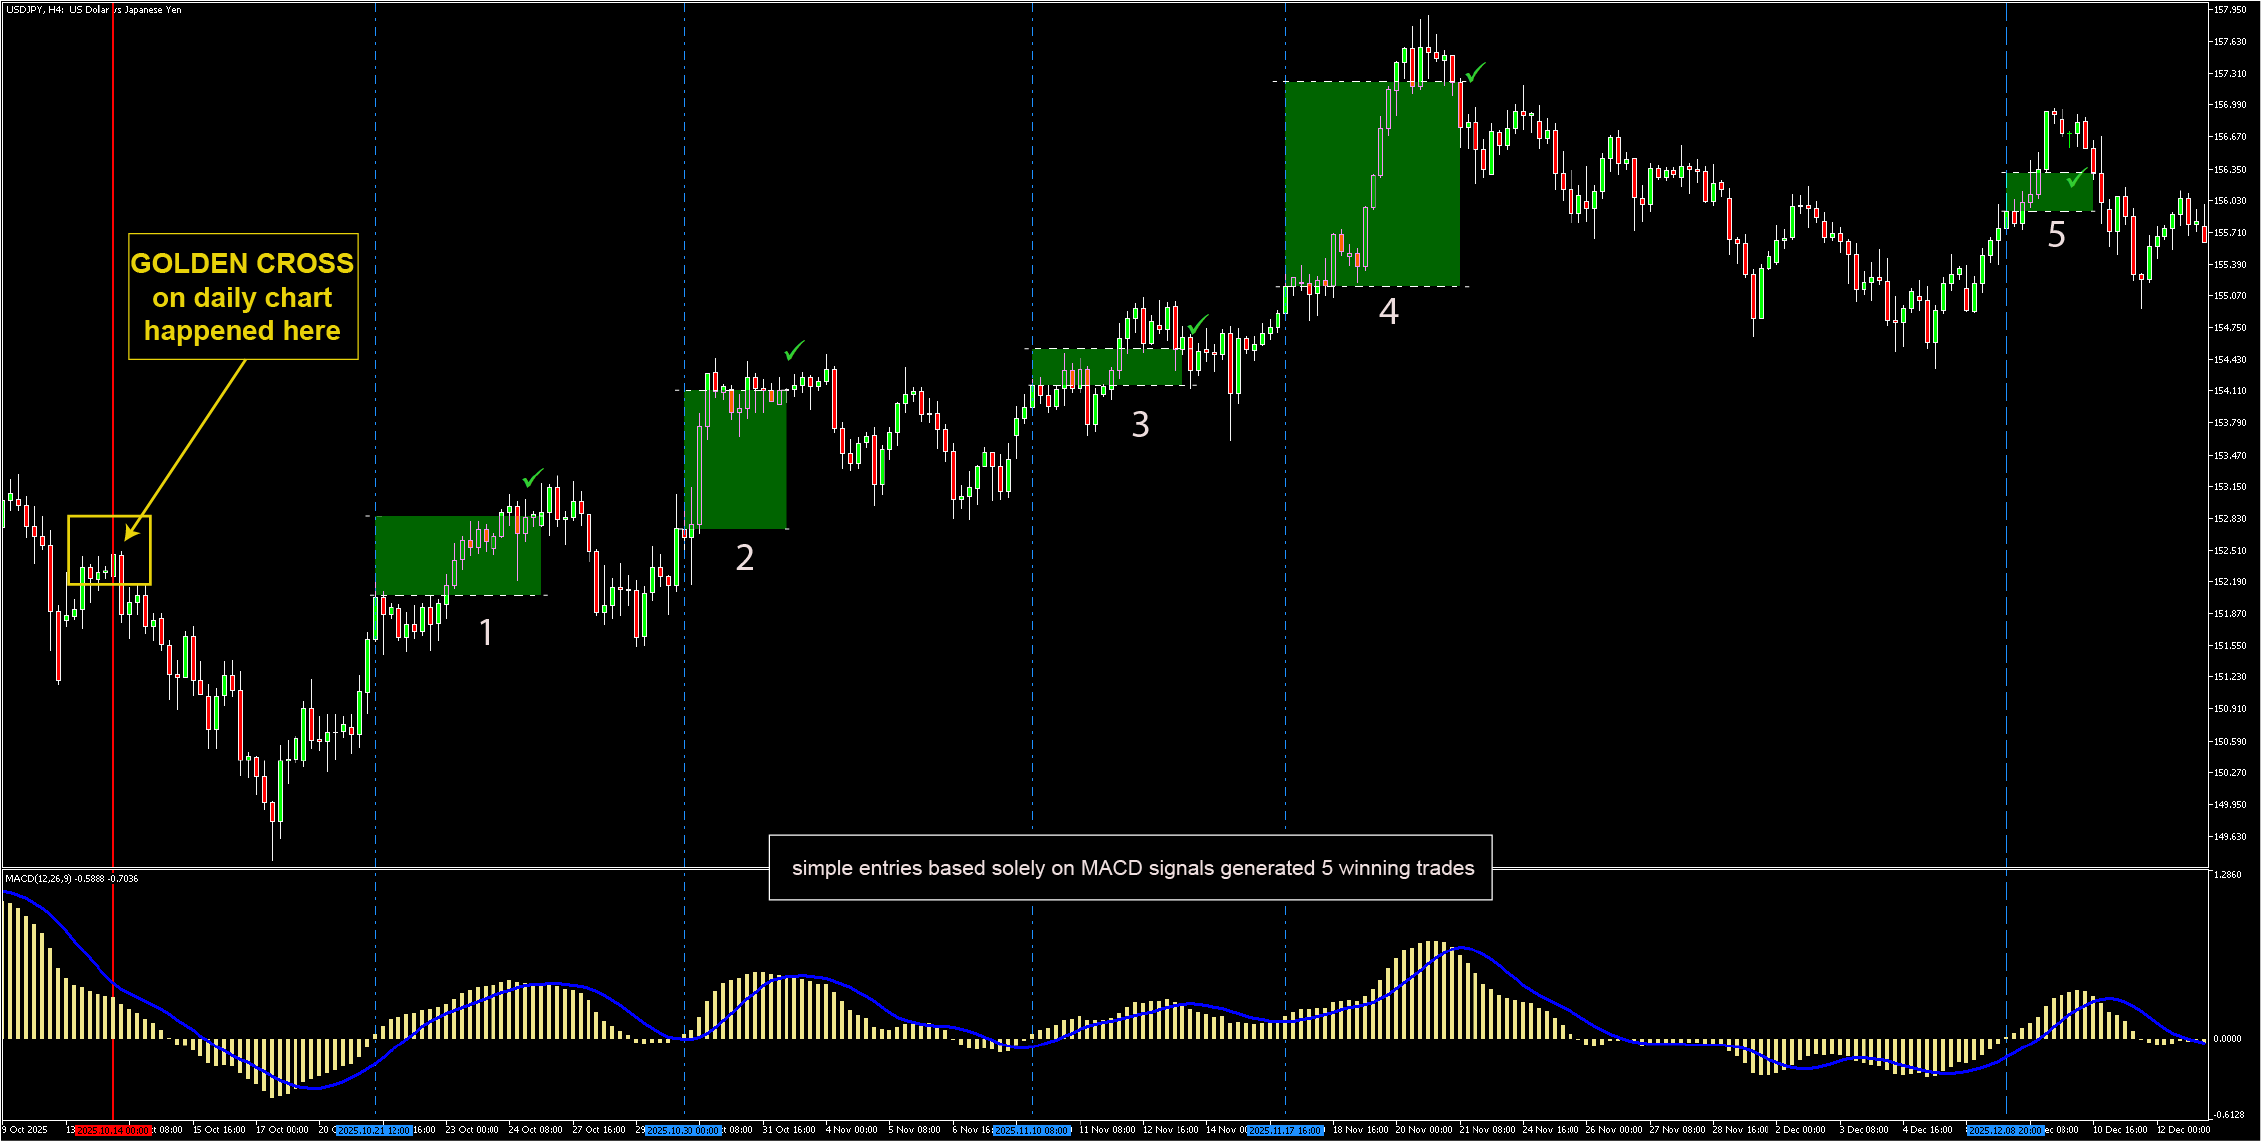
This strategy of trading lower timeframes in the direction of the golden/death cross on the higher timeframe has two major advantages:
- Prevents one of the biggest weaknesses of moving average crossovers which is they are lagging indicators. by the time the cross happens, a large part of the move may already be behind you.
- Aligns short-term trades with the broader trend. This improves trade selection and reduces the temptation to trade against the main trend.
2. Selective Buy-and-Hold with the Golden Cross
Instead of trading every golden cross, this strategy focuses only on markets and timeframes where the pattern has historically shown a clear statistical edge. By using your backtester first, you trade selectively and avoid low-probability setups.
How the strategy works:
- Identify markets where the golden cross has a strong historical win rate and positive average return.
- Enter a long position when the golden cross forms.
- Hold the position as long as the golden cross remains active (50-day SMA stays above the 200-day SMA).
- Exit the trade when the death cross appears (the reverse crossover).
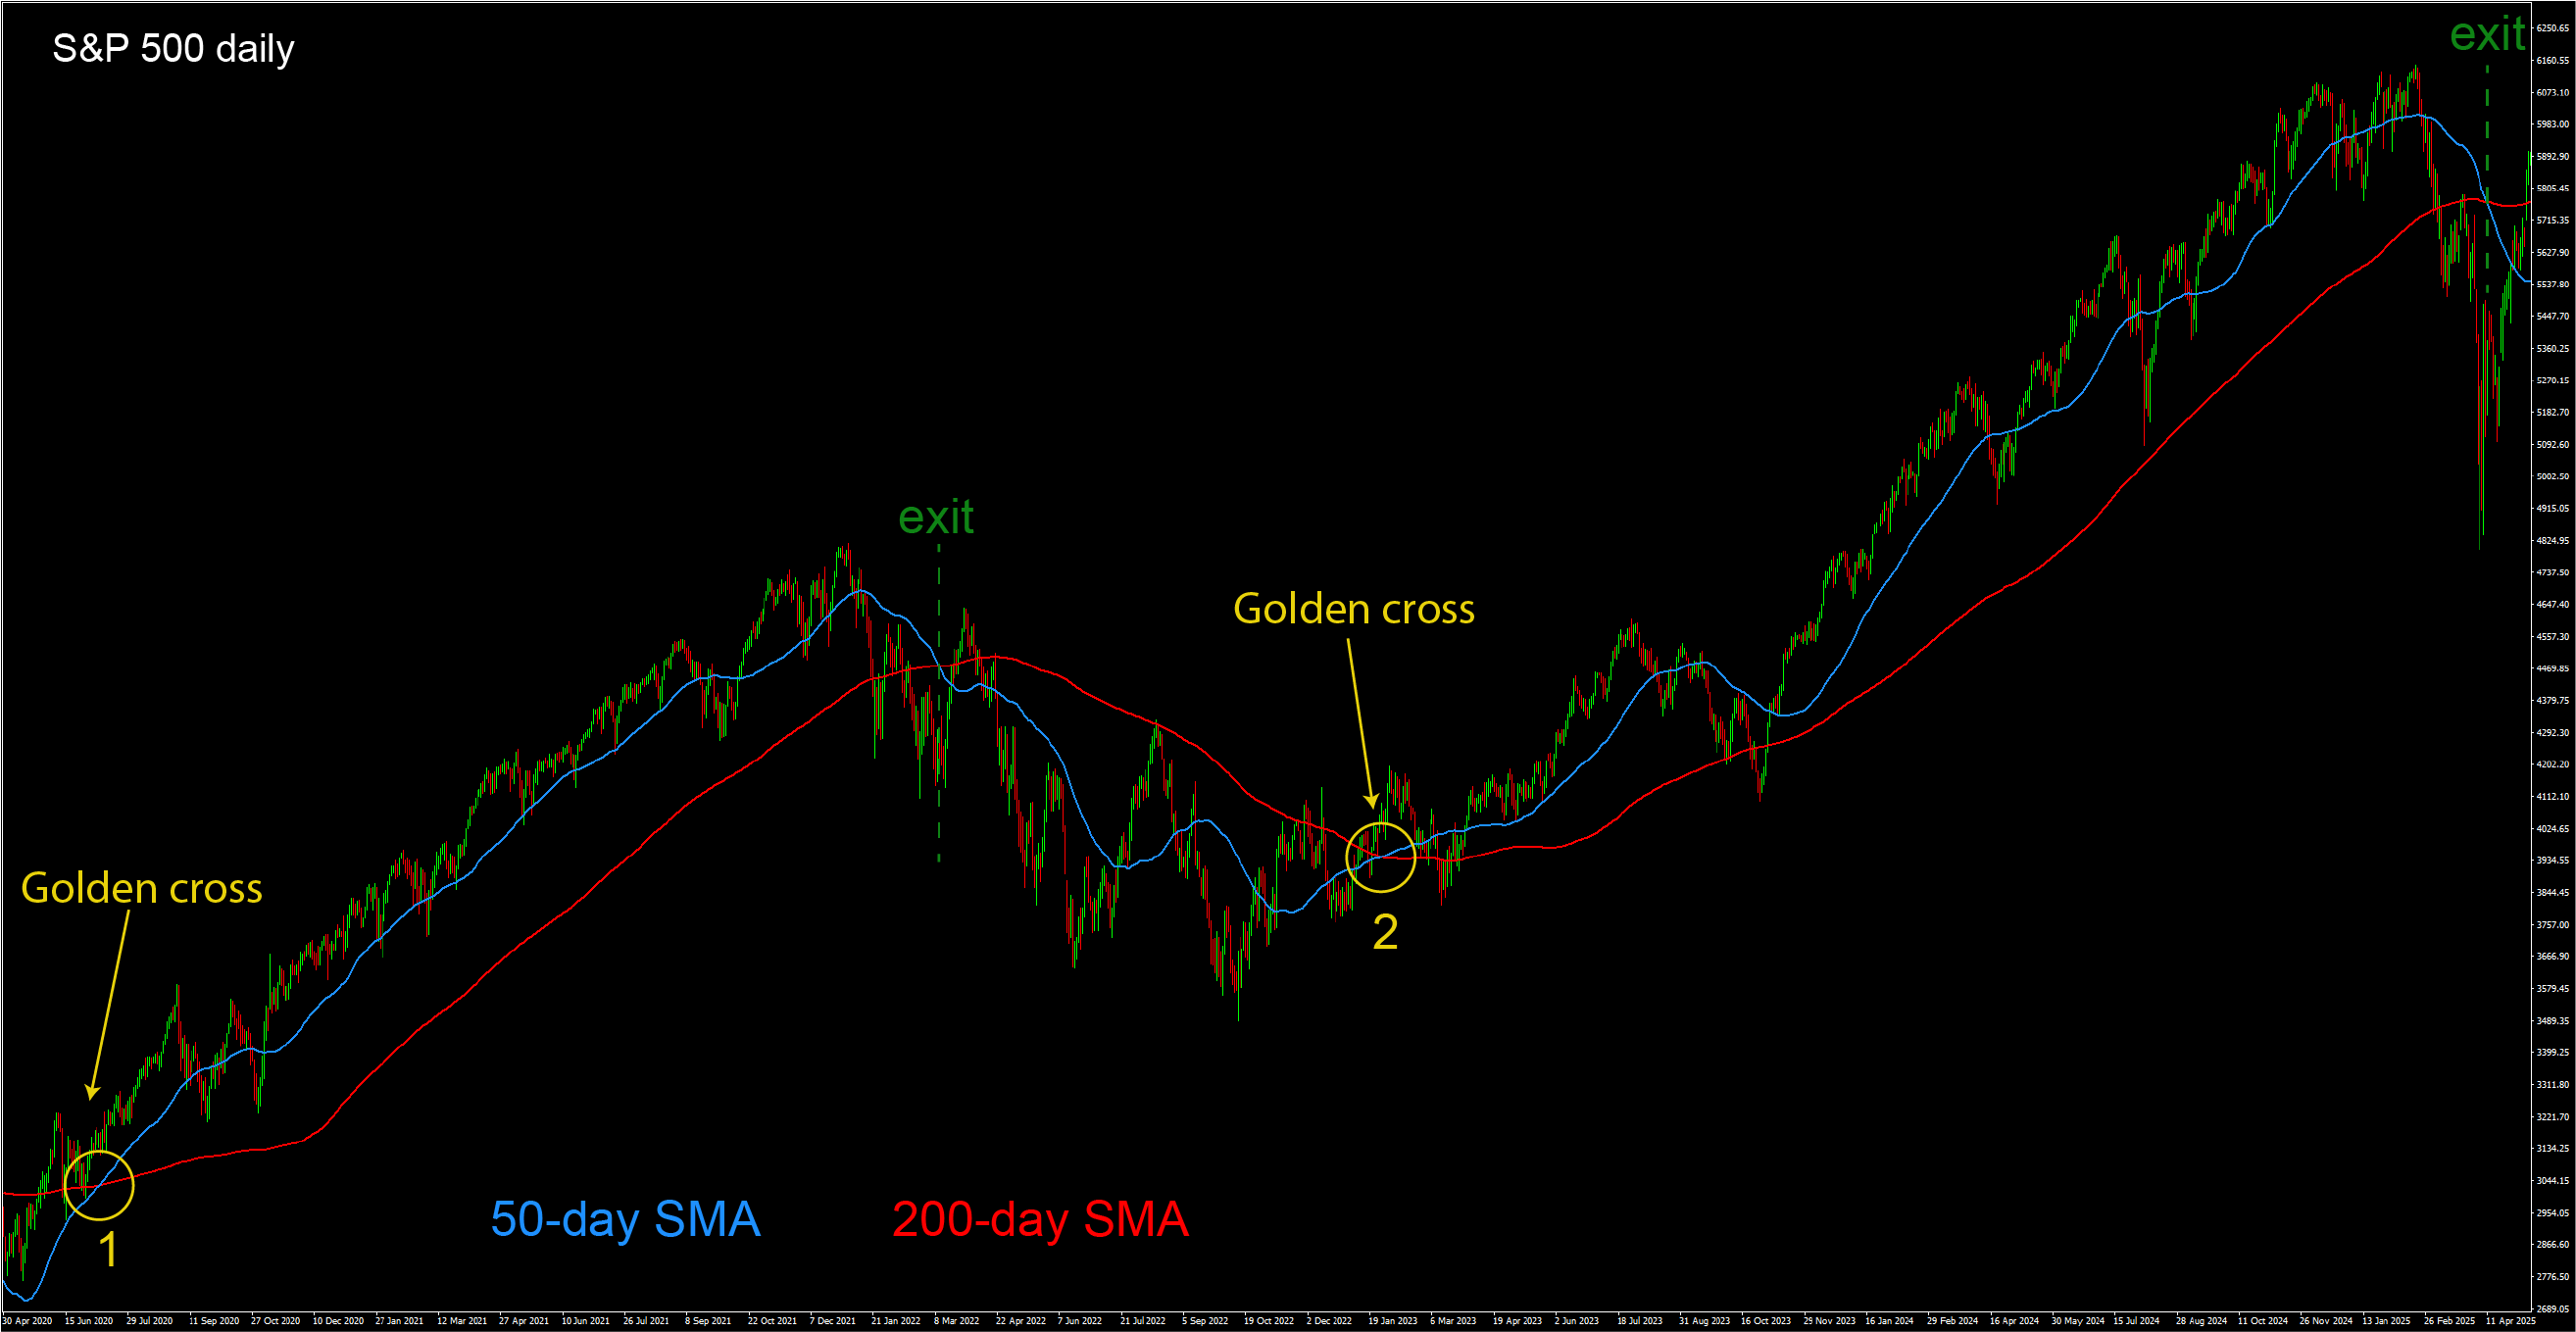
This approach works particularly well on daily timeframe in markets with strong trend persistence, such as stock indices cryptocurrencies during strong bullish cycles. In the S&P 500 (US500) chart above, notice the massive bull runs that follow the golden cross signals. Because this specific market has an inherent upward bias driven by economic growth, the crossover effectively catches the start of multi-year macroeconomic cycles.
Why the buy and hold with the Golden Cross strategy works
- Removes Emotion: By ignoring daily price fluctuations and relying entirely on the slow-moving 50/200 relationship, you eliminate the urge to exit early during routine market dips.
- Capitalizes on Compounding: When applied to structurally bullish markets like the S&P 500, holding through the entire golden cross cycle allows for massive compound growth that active swing trading rarely matches.
- Data-Backed Confidence: Because you only execute this strategy on charts pre-vetted by a backtester, you have the historical data required to stomach the inevitable drawdowns, knowing the mathematical edge is on your side.
3. Use the Golden or Death Cross as a Contrarian Indicator
The third strategy is to use the golden cross or death cross as a contrarian signal rather than a trend-following one. In certain markets, the standard signal can have a win rate so low that the "failed" signal itself becomes a high-probability entry for the opposite direction.
For example, the overall win rate of the death cross is below 20% on the S&P 500 and NASDAQ. This means the pattern is more often a bear trap than a signal for a meaningful downtrend.
Here is how the contrarian golden/death cross strategy works:
- Identify markets where the death cross has a historical success rate below 20%. Use the FR Golden/Death Cross success rate indicator to quickly assess the win rates across multiple markets and timeframes
- Wait for a Death Cross to form (50 SMA below the 200 SMA).
- Look for a reversal of that move and price reversing back into the 200 SMA. This is the first condition for a trade.
- Switch to a lower timeframe and look for entry signals based on other indicators or techniques such as support and resistance, breakouts or chart patterns.
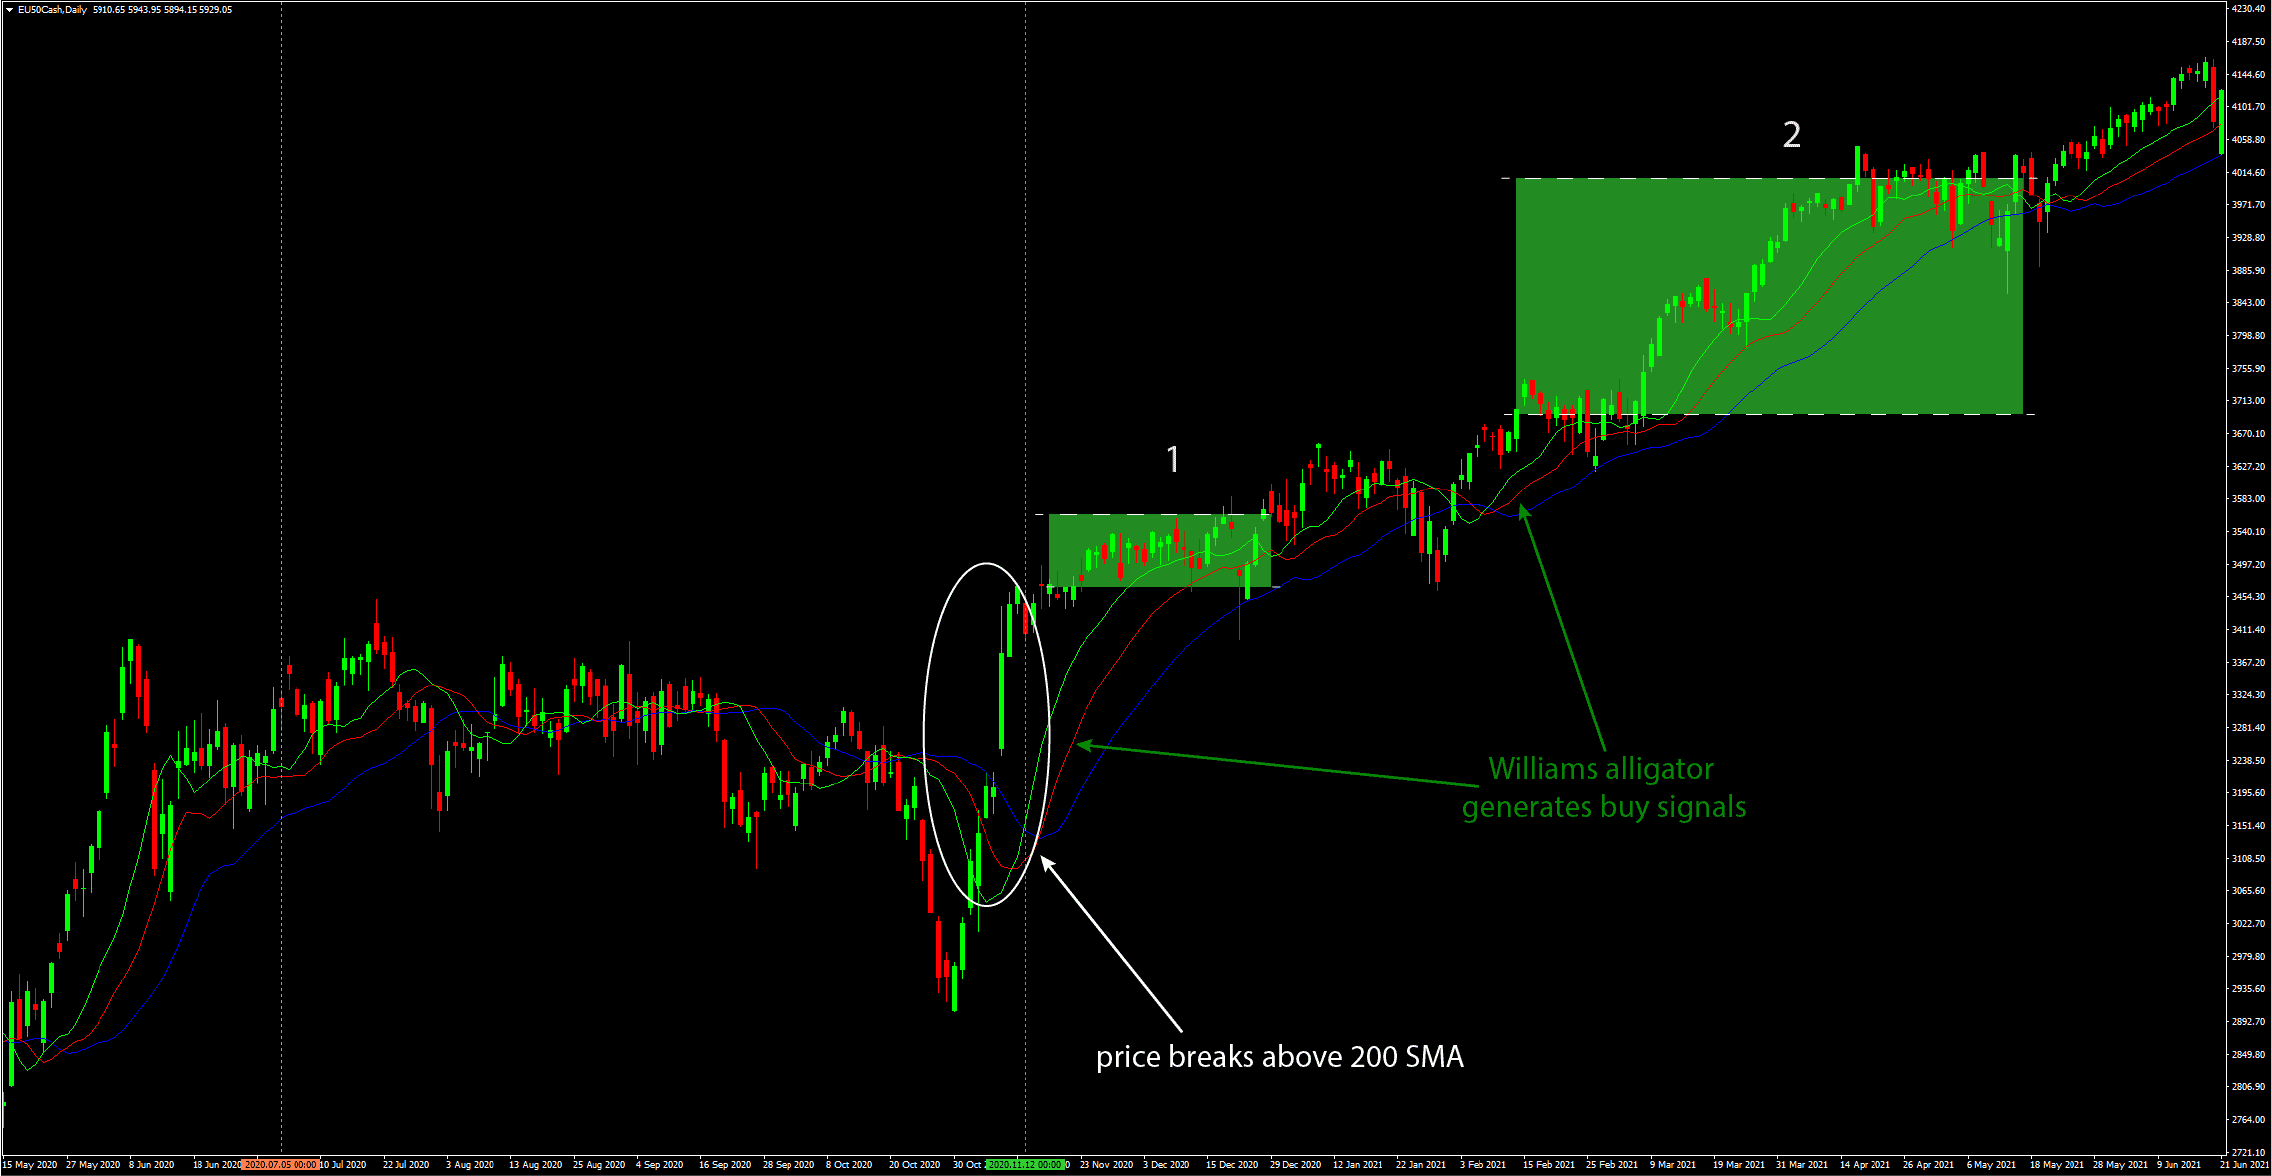
Let’s now look at this example on EURO STOXX 50 index. The Forex Recon Golden/Death Cross success rate indicator shows that the win rate of the date cross pattern on the EURO STOXX weekly timeframe is 12.5%.
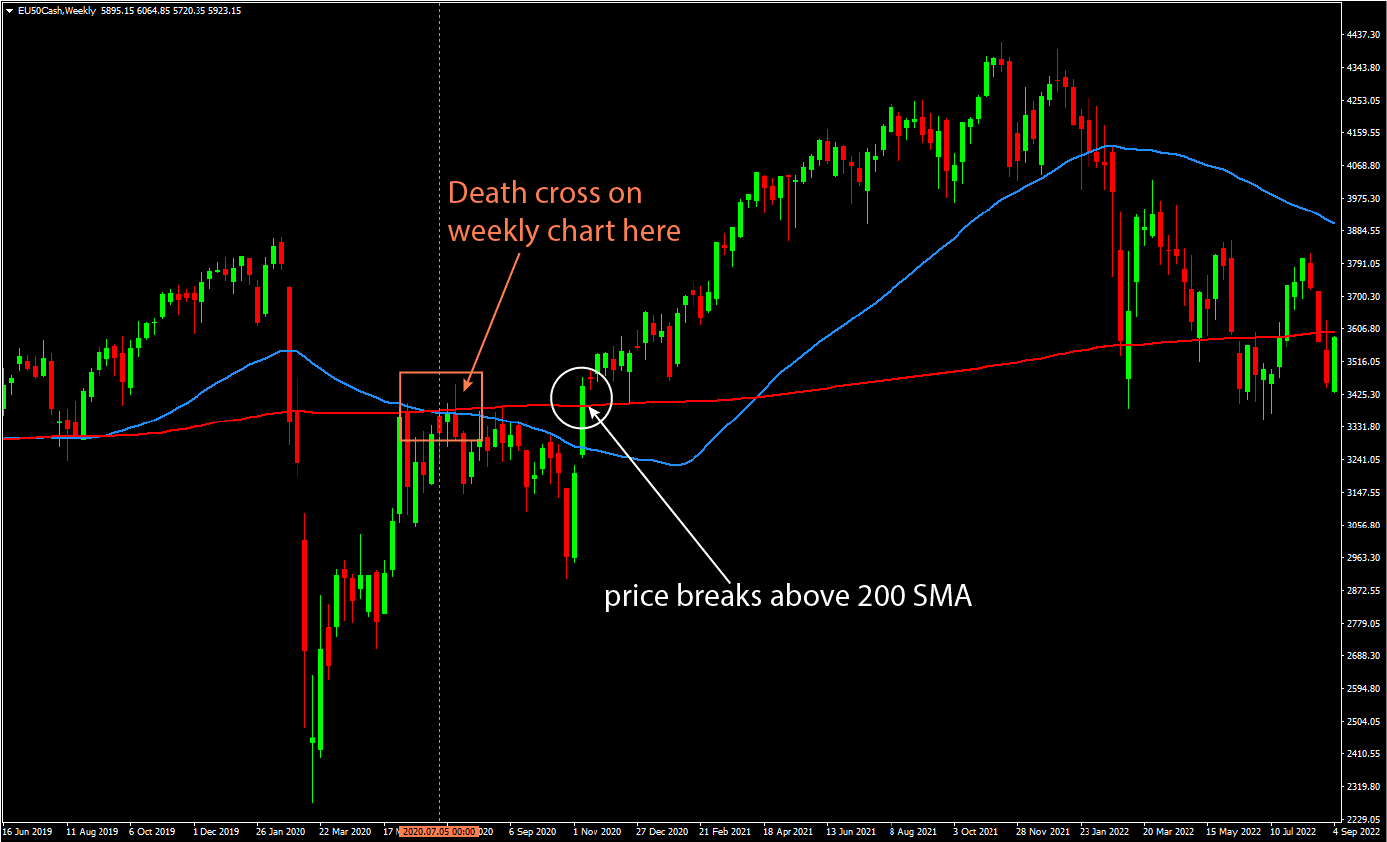
We take this death cross that occurred in 2020 and we switch to a lower timeframe, which in this case, is the daily. Here, using a simple indicator to generate buy signals like the Williams alligator resulted in two profitable trades.
FAQ
Are the golden cross and death cross reliable?
Their reliability varies significantly depending on the market, timeframe, and broader trend conditions. The same crossover can be profitable on one currency pair and unprofitable on another. The only way to know whether the pattern has an edge on the chart you trade is to backtest it directly.
What is the best timeframe for the golden cross and death cross?
The daily chart is the industry standard and the most widely followed version. The weekly chart is also highly respected, particularly for long-term trend confirmation. Lower timeframes such as the 4-hour and below produce more signals but significantly more false ones.
Do the golden cross and death cross work in forex?
They can, but results in forex are highly pair-dependent and timeframe-dependent. Because currencies trade in pairs without a structural long-term bias, the same crossover logic that works well on stock indices does not automatically translate to forex. Testing the pattern on each specific pair is essential.
Do the golden cross and death cross work in crypto?
Crypto markets often produce dramatic golden cross and death cross signals due to their strong trending nature. However, extreme volatility also creates more whipsaws and false signals. In crypto, these patterns are best used with additional confirmation from momentum indicators, volume analysis, and broader market sentiment.
Can I day trade the golden cross and death cross?
You can apply the concept to lower timeframes, but shorter charts create significantly more noise and false signals. Most traders find the patterns far more reliable on the daily and weekly timeframes. For intraday use, heavy filtering with other tools is recommended.
Should I use SMA or EMA for the crossover?
The classic golden cross and death cross use simple moving averages (SMA). Some traders prefer exponential moving averages (EMA) because they react faster to price changes, but this also increases false signals. When the terms "golden cross" and "death cross" are used without further detail, they refer to the 50 and 200 SMA by default.
What is the best way to test the success rate of these patterns?
The most efficient method is to use a dedicated backtesting tool. Our Golden Cross & Death Cross Backtester automatically scans any chart, identifies every historical crossover, and calculates the win rate and average return after 50, 100, and 200 bars. This gives you market-specific data rather than forcing you to rely on generic statistics.
Can the golden cross and death cross be used as contrarian signals?
Yes, in specific conditions. In markets where backtesting shows the pattern consistently fails — such as the death cross on major stock indices, which often appears near market bottoms — traders sometimes use the signal as a contrarian indicator rather than a trend-following one. This approach should only be used after thorough testing confirms the pattern has a negative expectancy in that market.


